Status of Organic farming
|
|
 Organic farming ensures that nature
stays clean and rich. If we visit an organic farm and we will notice a buzz
of animal, bird, and insect activity. Research shows that there are around 30
percent more wildlife and plants near ecological production fields compared
to conventional farming. This is because there are no pesticides, and
fertilizer is used far less. Covid-19 pandemic has changed the perception of
organic food, with spotlight now on safety and healthy food that is
nutritious to build a strong immune system. It is time to talk about nutritional
security not of food security only (which consist only carbohydrates). Among
the host of healthy food options available, organic food is perceived as the
preferred choice. Therefore, organic food witnessed an uptake since the onset
of pandemic. Organically grown foods generally contain higher levels of
antioxidants, certain micronutrients, no harmful chemicals, pesticides and
fertilizers, better taste and most important thing is organically grown
produce aids in the sustainability of the planet and in maintaining
ecological balance.
Organic farming ensures that nature
stays clean and rich. If we visit an organic farm and we will notice a buzz
of animal, bird, and insect activity. Research shows that there are around 30
percent more wildlife and plants near ecological production fields compared
to conventional farming. This is because there are no pesticides, and
fertilizer is used far less. Covid-19 pandemic has changed the perception of
organic food, with spotlight now on safety and healthy food that is
nutritious to build a strong immune system. It is time to talk about nutritional
security not of food security only (which consist only carbohydrates). Among
the host of healthy food options available, organic food is perceived as the
preferred choice. Therefore, organic food witnessed an uptake since the onset
of pandemic. Organically grown foods generally contain higher levels of
antioxidants, certain micronutrients, no harmful chemicals, pesticides and
fertilizers, better taste and most important thing is organically grown
produce aids in the sustainability of the planet and in maintaining
ecological balance.
According to FiBL survey 2021 India holds a unique position among 187 countries practicing organic agriculture. India is home to 30% of total organic producers in the world having 2.30 million ha. Total organic cultivation area, 27, 59,660 total farmers (11, 60,650 PGS and 15, 99,010 India Organic), 1703 total processors and 745 traders. A major relative increase of organic agricultural land was noted in recent past throughout the country.
 World Scenario of Organic Agriculture
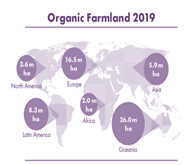
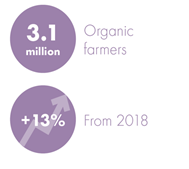
Organic agriculture is practiced in 187 countries, and 72.3 million hectares of agricultural land were managed organically by at least 3.1 million farmers. With the most organic agricultural land in Australia (35.69 m hectares) followed by Argentina (3.63 m hectares) and the Spain (2.35 m hectares). There has been an increase in organic agricultural land in all regions. The global sales of organic food and drink reached more than 106 billion euros in 2019. According to the latest FiBL survey on organic agriculture worldwide, organic farmland increased by 1.1 million hectares, and organic retail sales continued to grow. Apart from land dedicated to organic agriculture, there are further areas of organic land dedicated to organic activities. The largest part of these is wild collection areas and areas for livestock and beekeeping. Further non-agricultural areas include aquaculture, forest and grazing areas. These are totaled 35 million hectares. And all the organic areas together summed up to 107.4 million hectares (Organic World 2021).
Figure 01: Top Ten Countries in terms of largest certified organic area
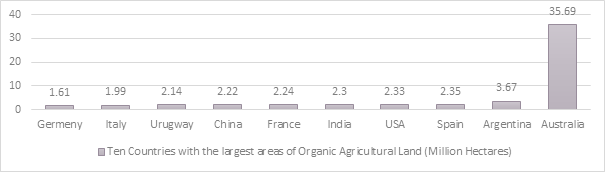
Source: FiBL Survey 2021
 The No. of Organic Producer increasing worldwide
In 2019, 3.1 million organic producers were reported. India continues to be the country with the highest number of producers (13,66,000), followed by Uganda (2,10,000), and Ethiopia (2,04,000). Most small-scale producers are certified in groups based on an internal control system. (FiBL Survey 2021)
Present Scenario of Organic Farming in India
Organic farming is in a nascent stage in India. About 2.30 million hectares of farmland was under organic cultivation as of March 2019. This is two per cent of the 140.1 million ha net sown area in the country. A few states have taken the lead in improving organic farming coverage, as a major part of this area is concentrated only in a handful of states. Madhya Pradesh tops the listwith 0.76 million ha of area under organic cultivation — that is over 27 per cent of India’s total organic cultivation area.
The top three states — Madhya Pradesh, Rajasthan and Maharashtra — account for about half the area under organic cultivation. The top 10 states account for about 80 per cent of the total area under organic cultivation.
Need for Organic Farming in India
The Green Revolution in the year 1960 changed the whole scenario in the field of agriculture where the farmers were introduced to high yielding seeds and fertilizers to maintain food security. Increasing productivity ensured profit but ultimately the land was turning barren due to the excessive usage of fertilizers making the soil infertile and pesticides turning the product dangerous to consume.
There are reasons for the need of the Organic Farming in India -
- The organic food industry is rising and is growing very fast ensuring high profitability.
- Food security needs to be addressed with the growing population and decreasing supply of resources which is why there is a need to increase the production but in a feasible and sustainable manner.
- Maintaining a clean and green environment is equally important, thus environmental sustainability needs to be maintained which can be achieved through organic farming.
- There needs to be an improvement in the health as the consumption can lead to many diseases such as cancer, infertility which happens when the toxic residue remains in the body, thus the safety of humans and animals are of utmost priority.
- The strike of balance between the environment and the livelihood becomes immensely important due to the risks caused by conventional agriculture practices.
|
Table-Indian Organic Agriculture Statistics for last 10 years
(2011-12 to 2020-21)
|
|
Sl No.
|
Year
|
Area Under Organic Cultivation
|
Number of farmers
|
Organic Production (MT)
|
Biofertilizer production
|
Total Organic Manure Production (MT)
|
|
NPOP
|
PGS-India
|
NPOP
|
PGS-India
|
NPOP
|
PGS-India
|
Liquid (in KL)
|
Career Based (MT)
|
|
1
|
2011-12
|
5550405
|
0
|
|
0
|
|
0
|
40324.21
|
34863600
|
|
2
|
2012-13
|
5211141
|
0
|
|
0
|
|
0
|
46836.82
|
41157700
|
|
3
|
2013-14
|
4719816
|
6064.14
|
|
5809
|
|
23612.42
|
2922.38
|
53838.3
|
22941500
|
|
4
|
2014-15
|
5690000
|
9249.39
|
|
11118
|
|
1079*
|
4054.56
|
80696.45
|
22986200
|
|
5
|
2015-16
|
5710384
|
19281.91
|
|
19355
|
|
6321660.53
|
6240.92
|
88029.3
|
25478600
|
|
6
|
2016-17
|
4452987
|
96291.6
|
|
173846
|
|
8760810.96
|
7526.33
|
109020.11
|
28029900
|
|
7
|
2017-18
|
3566538
|
6455.29
|
|
84618
|
|
17132676.09
|
9033.06
|
121066.54
|
33872000
|
|
8
|
2018-19
|
3428639
|
124989.9
|
|
166571
|
|
989255.06
|
22555.27
|
70417.77
|
41100974
|
|
9
|
2019-20
|
3669801
|
222369.55
|
|
365253
|
|
2047535.9
|
30105.94
|
79446.61
|
60594104
|
|
10
|
2020-21
|
4339185
|
7568.3
|
1599010
|
12074
|
3496800.34
|
3399520.21
|
42239.94
|
192329.29
|
42940832
|
|
Source:
|
|
as per IFOAM FiBL The world of Organic Agriculture, Statistics
and emerging trends for respective years
|
|
PGS-India Web Portal
|
|
*As per year wise certificate data available on PGS-India portal
dashboard
|
|
NCOF Annual report for respective years
|
|
CONSOLIDATED ORGANIC AGRICULTURAL STATISTICS FOR THE YEAR
2020-21 (https://apeda.gov.in/apedawebsite/organic/data.htm)
|
|
Data Not avilable
|
|
Data from source yet to identified
|
|
STATE WISE
PRODUCTION OF ORGANIC FERTILIZERS IN INDIA (2020-21)
|
|
Sl. No.
|
State
|
City Compost (A)
|
Organic manure (B)
|
Vermi0compost (C)
|
PROM
(D)
|
Bioenriched Organic
Manure (E)
|
Rural Compost (F)
|
Farm Yard Manure (G)
|
Total Manure MT
{A+B+C+ D+E +F+G)
|
Deoiled Cake MT
|
|
1
|
Andhra Pradesh
|
0
|
8.02
|
336.00
|
0
|
88.5
|
0
|
0
|
432.52
|
4108.00
|
|
2
|
Arunachal Pradesh
|
0
|
0
|
0
|
0
|
0
|
0
|
0
|
0
|
0
|
|
3
|
Assam
|
2350
|
49100
|
107731.22
|
1702
|
803.6
|
1312
|
11945
|
174943.82
|
121
|
|
4
|
Bihar
|
0
|
29215.1
|
75556.95
|
0
|
0
|
0
|
0
|
104772.05
|
0
|
|
5
|
Chhattisgarh
|
3998
|
829643
|
76150.46
|
0
|
0
|
515333
|
1002801
|
2427925.5
|
0
|
|
6
|
Delhi
|
21677
|
269
|
1098
|
0
|
0
|
0
|
0
|
23044.00
|
0
|
|
7
|
Goa
|
0
|
00
|
460
|
0
|
0
|
0
|
0
|
460.00
|
0
|
|
8
|
Gujarat
|
44236.56
|
87295.6
|
2128
|
27446.18
|
3500
|
4290
|
125450
|
294346.338
|
7130
|
|
9
|
Haryana
|
0
|
223.15
|
0
|
4576.410
|
0
|
0
|
0
|
4799.54
|
0
|
|
10
|
Himachal Pradesh
|
0
|
0
|
22.00
|
0
|
0
|
0
|
0
|
22.00
|
0
|
|
11
|
Jammu & Kashmir
|
0
|
0
|
0
|
0
|
0
|
0
|
0
|
00.00
|
0
|
|
12
|
Jharkhand
|
6196
|
5
|
360
|
40
|
4
|
0
|
0
|
6605
|
0
|
|
13
|
Karnataka
|
68824
|
183769
|
31355
|
14704
|
15092
|
1011125
|
37542874
|
38867743
|
2031
|
|
14
|
Kerala
|
9885.88
|
26038.75
|
752.5368
|
144
|
6489.032
|
312.6
|
356.89
|
43979.68
|
2330.25
|
|
15
|
Madhya
Pradesh
|
5436.7
|
28377
|
25520.9
|
11140.9
|
0
|
0
|
0
|
70475.4
|
0
|
|
16
|
Maharashtra
|
42231.00
|
34909.00
|
13312.00
|
40993.00
|
0
|
0
|
0
|
131445.00
|
7678.3
|
|
17
|
Manipur
|
0
|
100
|
0
|
0
|
50
|
0
|
0
|
150
|
0
|
|
18
|
Meghalaya
|
0
|
0
|
0
|
0
|
0
|
0
|
0
|
0
|
0
|
|
19
|
Mizoram
|
0
|
0
|
6
|
0
|
0
|
0
|
0
|
6
|
0
|
|
20
|
Nagaland
|
0
|
15015
|
1060.5
|
0
|
0
|
12726
|
52520
|
81321.5
|
0
|
|
21
|
Odisha
|
13153.5
|
12,102
|
17064.5
|
680
|
785
|
0
|
5565
|
49,350
|
0
|
|
22
|
Punjab
|
36005.22
|
1458.66
|
545
|
6116.98
|
37.22
|
0
|
0
|
44163.08
|
236.47
|
|
23
|
Rajasthan
|
17870
|
2960
|
12425
|
11442
|
70
|
0
|
0
|
44767.00
|
0
|
|
24
|
Sikkim
|
0
|
0
|
0
|
0
|
0
|
0
|
0
|
0
|
0
|
|
25
|
Tamil Nadu
|
57456.8
|
55461.55
|
4451.042
|
588.9816
|
157.7
|
324149
|
0
|
442265
|
20138
|
|
26
|
Telengana
|
24706.00
|
1197.1
|
29.121
|
927.3
|
230.0
|
0
|
0
|
27134.00
|
0
|
|
27
|
Tripura
|
0
|
0
|
522.015
|
383.05
|
85.151
|
0
|
0
|
990.216
|
0
|
|
28
|
Uttar Pradesh
|
0
|
7703
|
131
|
7614.75
|
17789.49
|
0
|
0
|
33238.24
|
0
|
|
29
|
Uttarakhand
|
2100
|
396.64
|
0
|
3462.63
|
0
|
0
|
0
|
5959.27
|
2700
|
|
30
|
West Bengal
|
50750
|
261
|
2343.09
|
810.7
|
7983.84
|
0
|
114.69
|
59294.32
|
0
|
|
31
|
Chandigarh
|
0
|
0
|
0
|
0
|
0
|
0
|
0
|
0
|
0
|
|
32
|
Puducherry
|
0
|
0
|
0
|
0
|
0
|
600
|
600
|
1200
|
70
|
|
|
Total
|
406876.66
|
1,365,507.57
|
373360.3348
|
132772.8816
|
53077.033
|
1869847.6
|
38742226.58
|
42,940,832.474
|
46543.02
|
|
Source : Data received
from states.
|
|
STATEWISE PRODUCTION OF BIOFERTILISERS IN INDIA
(2020-21)
|
|
SI.No.
|
State
|
Carrier based (MT)
|
Liquid based (KL)
|
|
1
|
And
&Nic island
|
0
|
0
|
|
2
|
Andhra
Pradesh
|
123.19
|
98.49
|
|
3
|
Daman
& Diu
|
0.00
|
0.00
|
|
4
|
Karnataka
|
1446.50
|
870.53
|
|
5
|
Kerala
|
164.98
|
2612.00
|
|
6
|
Lakshdweep
|
0.00
|
0.00
|
|
7
|
Puducherry
|
97.17
|
2.16
|
|
8
|
Tamilnadu
|
88652.43
|
434.313
|
|
9
|
Telangana
|
448.72
|
150.14
|
|
9
|
Chattisgarh
|
558.88
|
268.68
|
|
10
|
Gujrat
|
19483.31
|
8055.72
|
|
11
|
Goa
|
30.00
|
0.00
|
|
12
|
Madhya
Pradesh
|
21834.30
|
15811.10
|
|
13
|
Maharashtra
|
5328.18
|
2140.95
|
|
14
|
Rajasthan
|
10612.00
|
0.00
|
|
15
|
D & N
Haveli
|
0.00
|
0.00
|
|
16
|
Delhi
|
0
|
0
|
|
17
|
Chandigarh
|
0.00
|
0.00
|
|
18
|
Haryana
|
3105.42
|
113.17
|
|
19
|
Himachal
Pradesh
|
0.22
|
0.22
|
|
20
|
Jammu
& Kashmir
|
0.00
|
0.00
|
|
21
|
Punjab
|
16042.27
|
361.37
|
|
22
|
Uttar
Pradesh
|
0.00
|
5725.64
|
|
23
|
Uttarakhand
|
3708.83
|
1150.81
|
|
24
|
Bihar
|
74.59
|
2.11
|
|
25
|
Jharkhand
|
0.00
|
0.00
|
|
26
|
Odisha
|
19406.64
|
859.60
|
|
27
|
West
Bengal
|
448.59
|
33.54
|
|
28
|
Arunachal
Pradesh
|
0.00
|
0.00
|
|
29
|
Assam
|
438.54
|
3447.35
|
|
30
|
Manipur
|
20.00
|
24.01
|
|
31
|
Meghalaya
|
0.00
|
0.00
|
|
32
|
Mizoram
|
1.40
|
0.00
|
|
33
|
Nagaland
|
19.14
|
0.00
|
|
34
|
Sikkim
|
0.00
|
69.02
|
|
35
|
Tripura
|
283.99
|
9.02
|
|
Grand
Total
|
192329.2896
|
42239.9351
|
|
STATEWISE PRODUCTION OF BIOFERTILISERS IN INDIA
(2020-21)
(Zone wise)
|
|
State
|
Carrier based (MT)
|
Liquid based (KL)
|
|
South Zone
|
|
|
|
|
1
|
Andaman
& Nicobar Island
|
0
|
0
|
|
2
|
Andhra
Pradesh
|
123.19
|
98.49
|
|
3
|
Daman
& Diu
|
0.00
|
0.00
|
|
4
|
Karnataka
|
1446.50
|
870.53
|
|
5
|
Kerala
|
164.98
|
2612.00
|
|
6
|
Lakshadweep
|
0.00
|
0.00
|
|
7
|
Puducherry
|
97.17
|
2.16
|
|
8
|
Tamil
Nadu
|
88652.43
|
434.313
|
|
9
|
Telengana
|
448.72
|
150.14
|
|
West Zone
|
|
|
|
|
1
|
Chhattisgarh
|
558.88
|
268.68
|
|
2
|
Gujarat
|
19483.31
|
8055.72
|
|
3
|
Goa
|
30.00
|
0.00
|
|
4
|
Madhya
Pradesh
|
21834.30
|
15811.10
|
|
5
|
Maharashtra
|
5328.18
|
2140.95
|
|
6
|
Rajasthan
|
10612.00
|
0.00
|
|
7
|
Dadar&
Nagar Haveli
|
0.00
|
0.00
|
|
North Zone
|
|
|
|
|
1
|
Delhi
|
0
|
0
|
|
2
|
Chandigarh
|
0.00
|
0.00
|
|
3
|
Haryana
|
3105.42
|
113.17
|
|
4
|
Himachal
Pradesh
|
0.22
|
0.22
|
|
5
|
Jammu
& Kashmir
|
0.00
|
0.00
|
|
6
|
Punjab
|
16042.27
|
361.37
|
|
7
|
Uttar
Pradesh
|
0.00
|
5725.64
|
|
8
|
Uttarakhand
|
3708.83
|
1150.81
|
|
East Zone
|
|
|
|
|
1
|
Bihar
|
74.59
|
2.11
|
|
2
|
Jharkhand
|
0.00
|
0.00
|
|
3
|
Odisha
|
19406.64
|
859.60
|
|
4
|
West
Bengal
|
448.59
|
33.54
|
|
North East Zone
|
|
|
|
|
1
|
Arunachal
Pradesh
|
0.00
|
0.00
|
|
2
|
Assam
|
438.54
|
3447.35
|
|
3
|
Manipur
|
20.00
|
24.01
|
|
4
|
Meghalaya
|
0.00
|
0.00
|
|
5
|
Mizoram
|
1.40
|
0.00
|
|
6
|
Nagaland
|
19.14
|
0.00
|
|
7
|
Sikkim
|
0.00
|
69.02
|
|
8
|
Tripura
|
283.99
|
9.02
|
|
Total
|
192329.2896
|
42239.9351
|
|
*
Source : Data received from States
|
|
×
Share your Idea or Success story to boost up organic farming


 कृषि एवं किसान कल्याण विभाग